Infographic Design Sample - Professional & Customizable
Infographic Design Sample - Professional & Customizable
Couldn't load pickup availability
Create visually compelling infographics with our professional Infographic Design Sample. This template demonstrates effective data visualization techniques and provides a ready-to-customize framework for presenting complex information in an engaging, easy-to-understand format.
Sample Topic Included:
"The Impact of Climate Change on Global Weather Patterns"
What's Included:
Introduction Section:
- Concise overview introducing the viewer to the topic
- Clear explanation of how climate change influences weather patterns worldwide
- Professional header and title design
Key Sections with Visual Elements:
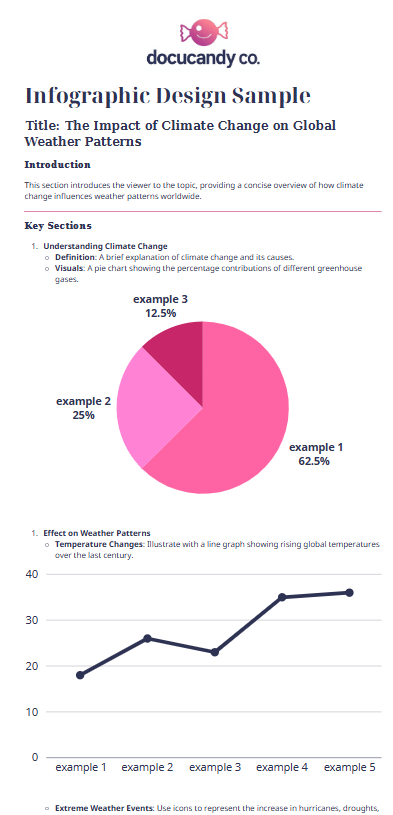
1. Understanding Climate Change:
- Definition: Brief explanation of climate change and its causes
- Visuals: Pie chart showing percentage contributions of different greenhouse gases
- Example data: 62.5%, 25%, 12.5% distribution
- Professional pink gradient color scheme
2. Effect on Weather Patterns:
- Temperature Changes: Illustrate with line graph showing rising global temperatures over the last century
- Clear data visualization with labeled axes and data points
- Example timeline showing temperature trends across 5 examples
3. Extreme Weather Events:
- Use icons to represent the increase in hurricanes, droughts, floods, and wildfires
- Visual representation of climate impact
Design Elements Included:
- Professional pink gradient color palette
- Pie charts with percentage breakdowns
- Line graphs with clear data points
- Clean typography and section headers
- Balanced layout with white space
- Icon and visual element placement
- Data visualization best practices
Key Features:
- Professional infographic design sample
- Fully customizable template - change topic, data, colors, and content
- Multiple chart types demonstrated (pie chart, line graph)
- Clear visual hierarchy and information flow
- Editable in design software (Adobe Illustrator, Canva, PowerPoint)
- Available in high-resolution formats (PDF, PNG, AI)
- Instant digital download - no shipping required
- Perfect for presentations, reports, social media, and marketing materials
Benefits:
- Save design time with professional template structure
- Learn effective data visualization techniques
- Create engaging content that captures attention
- Present complex information in digestible format
- Customize for any topic or industry
- Maintain professional brand standards
- Increase engagement and information retention
Perfect For:
- Business presentations and reports
- Educational materials and research
- Marketing campaigns and social media
- Annual reports and white papers
- Blog posts and articles
- Conference presentations
Transform complex data into compelling visual stories with this professional infographic design sample that you can customize for any topic or purpose.
Share